PRTG Network Monitor Feature Overview
Quick Download, Installation and Configuration
- Quick ad-hoc Download (70 MB): no web forms or registration hassles
- Runs on all Windows versions XP or later: server or workstation, 32 or 64 bit
- Installs in 3 minutes: no additional downloads (.NET, SQL Server etc.) required
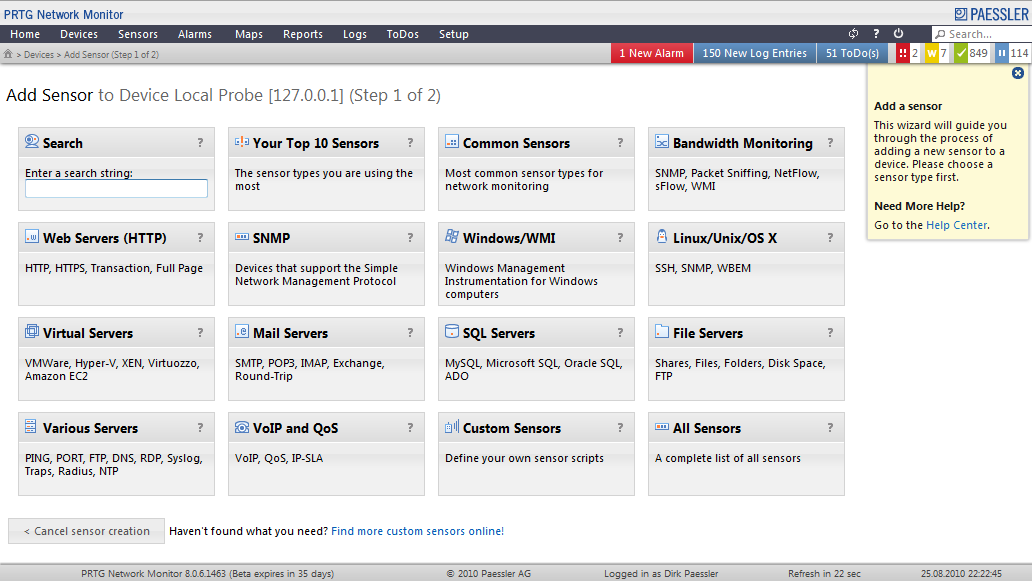
- Interactive guidance by the software: For initial setup, most users will not need to read the manual (or need to have training)
- Option 1: Auto Discovery creates sensors for your network (about 1 min per device)
- Option 2: Manual device/sensor setup (about 5 min per device)
- Full featured web browser based Interface: state of the art, AJAX based web site
- HTML only, minimalistic web browser based interface (feature limited) for older browsers and mobile devices (runs on IE6/7, iPhone, Android, Blackberry)
- Enterprise Console: native Windows application especially for large installations
- Apps for iOS (iPhone/iPad) and Android smartphones / tablets: Access monitoring status on-the-road (separate download)
- All user interfaces allow SSL-secured local and remote access and can be used simultaneously
- Read more about the user interface options in the PRTG manual

Comprehensive Network Monitoring
- More than 100 sensor types covering all aspects of network monitoring
- Uptime/Downtime Monitoring
- Bandwidth Monitoring using SNMP, WMI, NetFlow, sFlow, jFlow, Packet Sniffing
- Application Monitoring
- Virtual Server Monitoring
- SLA monitoring
- VoIP/QoS Monitoring
- Environmental Monitoring
- LAN, WAN, VPN, and Multiple Site Monitoring
- Extensive event logging
- Agentless monitoring (optional agents (remote probes) allow monitoring for even deeper metrics)
Flexible Alerting
- 9 notification technologies: Send Email, SMS/Pager, syslog and SNMP Trap, HTTP request, Event log entry, Play alarm sound files, Amazon SNS, any external technology that can be triggered by an EXE or batch file
- Status alerts (up, down, warning)
- Limit alerts (value above/below x)
- Threshold alerts (above/below x for y minutes)
- Multiple condition alerts (x and y are down)
- Escalation alerts (extra notifications every x min during downtime)
- Dependencies (avoid alarm floods)
- Acknowledged Alarms (no more notifications for this alarm)
- Alert Scheduling (no low priority alerts at night)

PRTG Cluster Failover Solution
- In a PRTG Cluster up to 5 PRTG instances ("Nodes") work together to create a failover tolerant monitoring system.
- Not even a software update causes downtime for a PRTG cluster.
- The cluster performs automatic failovers: If the primary node fails or loses connection to the cluster, another node immediately becomes the master server and takes over the sending of notifications. Thus notifications are always sent, even if the primary master has no connectivity or has crashed.
- Moreover, you can achieve multiple points-of-presence monitoring, all nodes monitor all sensors all the time. This means that response times are measured from different locations in the network (LAN/WAN/VPN) and can be compared with each other. Additionally, aggregated up/downtimes can be computed.
- And here comes the best part: All PRTG licenses allow you to create a "Single Failover" installation (two installations of PRTG working together) with just one license key (additional license keys are required for 3 or more nodes).
- More information on clustering
Please note: Remote Probes can only be connected to one node of a cluster.

Distributed Monitoring Using Remote Probes
With the so called Remote Probes PRTG Network Monitor can be used to monitor several networks in different locations:
- Monitor all subsidiaries from the headquarter
- Monitor separated networks within your company (e.g. DMZ and LAN)
- As MSP you can monitor your customer's networks and increase the quality of service
All you need one central installation of the PRTG Core Server. Each PRTG license includes unlimited Remote Probes. You can find more details in the manual.

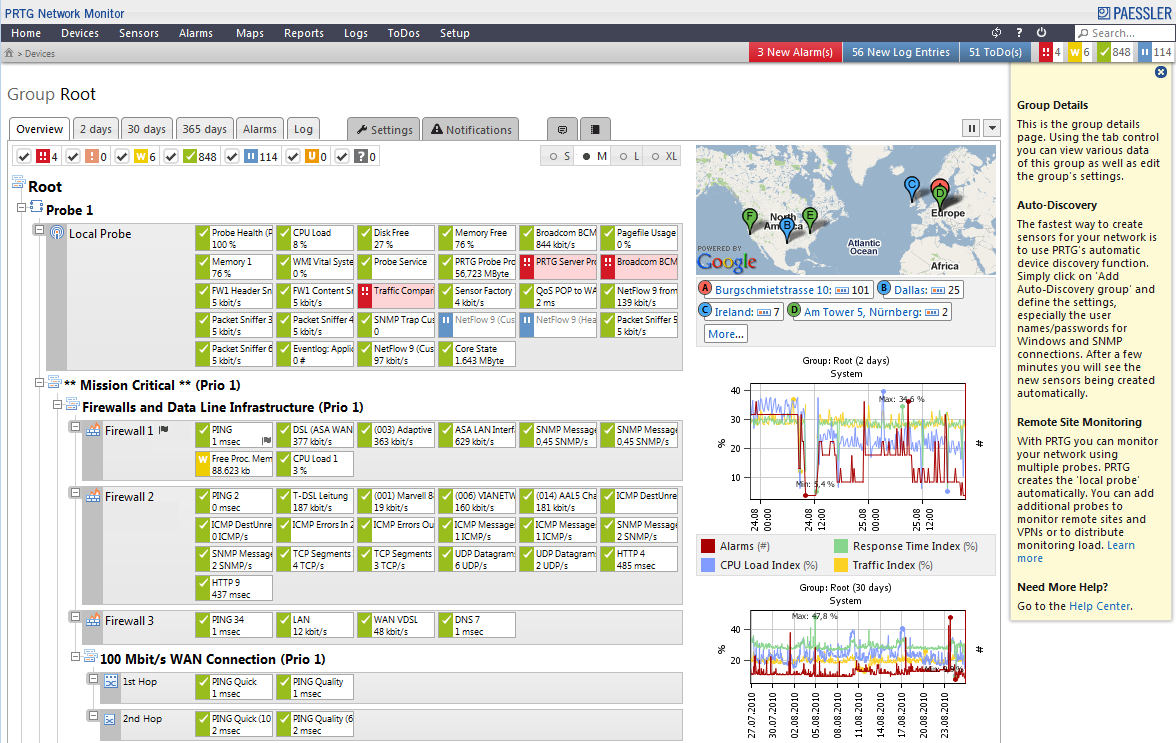
Data Publishing and Maps
- Real time dashboards with live performance and status information
- Private and public dashboards: e.g. screens for network operations centers or maps with at-a-glance information for other employees
- Interactive map designer with more than 300 different map objects (network icons, status icons, traffic charts, top 10 lists, etc.)
- Click here for more and detailed features

Easy to Understand - Multi Language Interface
PRTG comes in different languages: English, German, Spanish, French, Dutch, Japanese, and Chinese. You can easily switch between these languages, even after the installation. PRTG can also be translated into any other language using the PRTG Translation Tool.
In-Depth Reporting
- Reports in HTML or PDF format
- Reporting tasks can be run ad-hoc or scheduled (daily, weekly, monthly)
- Historic monitoring data can be exported as HTML, XML, CSV
- More than 30 report templates included
- Detailed graphs and data tables for one or more sensors
- Uptime/Downtime (% and seconds)
- Good/failed requests (% and totals)
- Top 100 Bandwidth Usage
- Top 100 CPU Usage
- Top 100 Ping Times
- Top 100 Disk Space
- Top 100 Uptime/Downtime
- And several others
- Click here for screenshots, sample reports and more detailed information

- PRTG supports monitoring from 1 up to 30,000 sensors per installation (max. number of sensors under optimal conditions)
- Paessler's proprietary database system is highly optimized for monitoring data (data is accessible through API)
- Much faster than SQL servers with less CPU usage
- Powerful enough to store years of data for thousands of sensors
- Low system requirements: Even a Netbook can monitor 1,500 sensors
- Multiple Probes allow to distribute high loads
- Multi site monitoring secured by SSL encryption for probe and cluster connections
- SSL secured web server (HTTPS) for Web, Windows and iPhone GUI
- Multiple User accounts with shared and private sensors as well as rights management
- More security features

Support for Customization
- Customizable Web interfaces (Reports and web interface can be "branded")
- Custom Sensors (EXE, CMD, Powershell, etc.)
- Custom Notifications
- Custom Device Templates
- Custom OIDLIB files
- PRTG RESTful API allows to create/edit/delete monitoring objects and to access monitoring data
- PRTG translation tool - translate the PRTG interface into your language

Why PRTG from Paessler?
- Software Engineering Made in Germany
- Paessler has been creating network monitoring tools since 1997
- Proven and reliable: Our software is in use by more than 150.000 users every day
- Ongoing customer satisfaction survey: >95% of our customers recommend PRTG to others
- Ongoing development and enhancement of the software since 1997
- PRTG is certified by various technology leaders:Cisco compatible, Works with Windows 2008 Server by Microsoft, vmware technology alliance partner, etc...
- World Class Support
- Inquiries answered in less than 24 hours on business days
- Answers come from our own in-house support engineers and the developer staff
- Paessler provides an extensive online Knowledge Base

No comments:
Post a Comment